NPV Calculation In Excel Is Wrong!, But Why?
So, you set up a nicely laid out year by year cash flows, and used Excel’s inbuilt NPV function, but the final answer is wrong? You are not alone!
The culprit here is assuming that NPV formula in Excel works the way we want it to work.
Let’s see how exactly the NPV function works, and how to avoid blindly trusting the assumptions and formulas.
So, My NPV Calculation in Excel is Wrong?
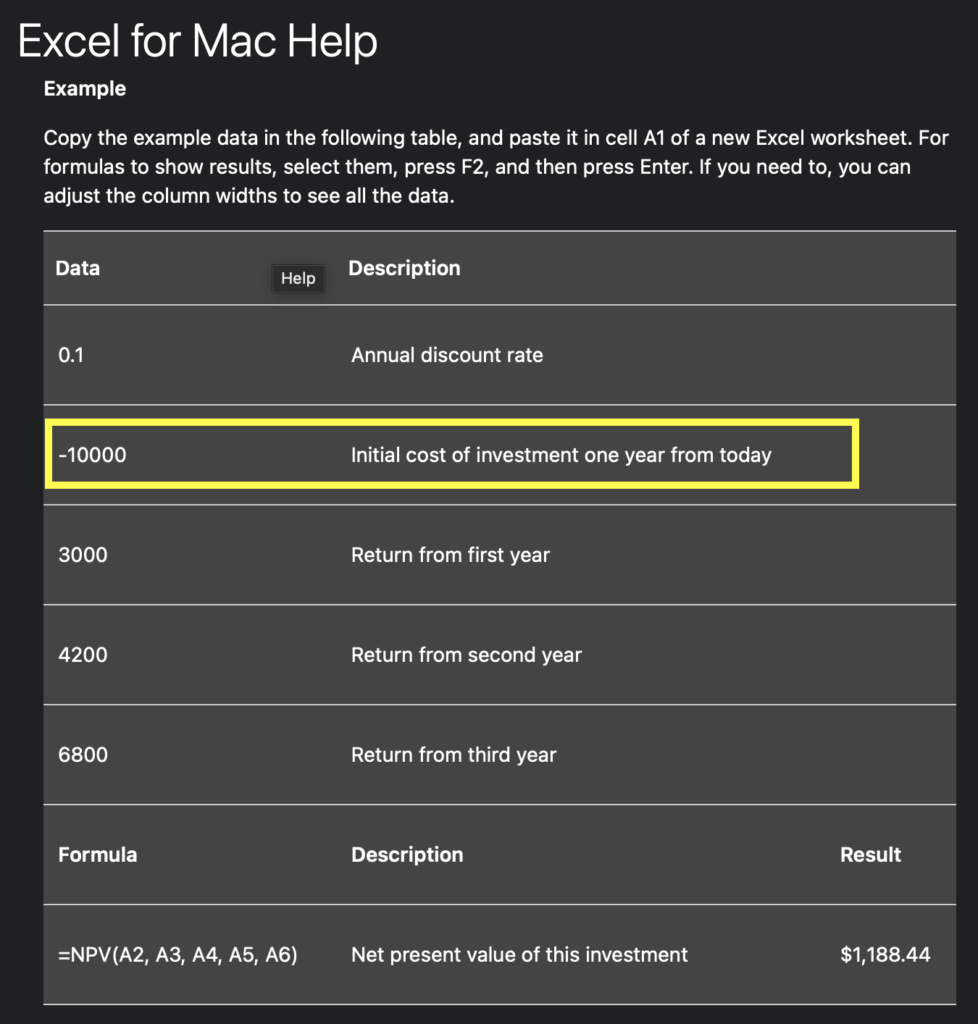
Reason 1: The first cash flow ‘-10000’ is the investment at the end of 1st year.
In most cases of NPV calculation, the initial investment is assumed to be at time t=0 or in year 0, or at the beginning of the year.
Reason 2: The second cash flow is ‘3000’ is the cash flow at the end of 2nd year. yes end of SECOND year. This seems to be a major flaw in Excel’s NPV function and has made thousands of students pull their hair trying to figure out why their answers are incorrect!
Even the ‘help’ article on NPV() function in Excel doesn’t clarify this well.
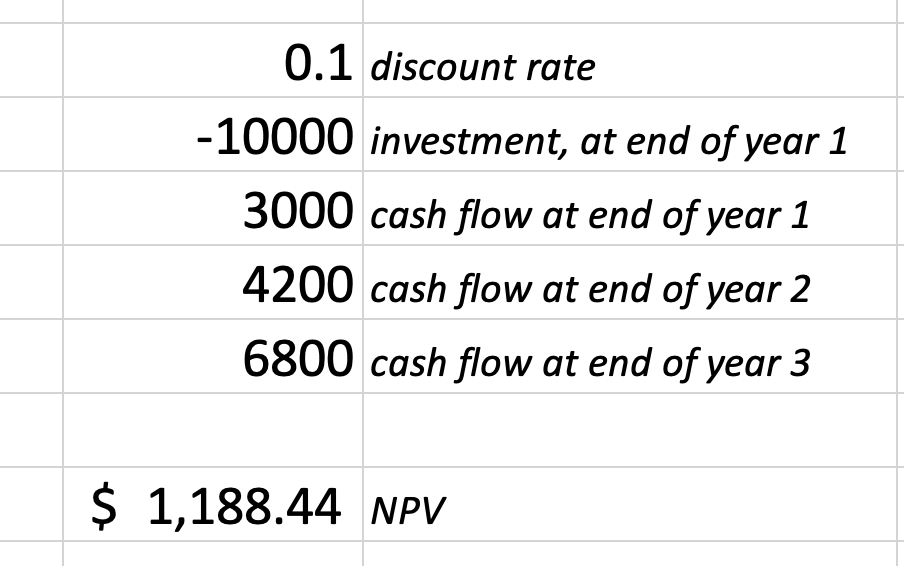
Let’s verify what is happening. I am using the same numbers as shown in the help article – discount rate of 10%, investment of 10,000, and then three cash flows of 3000, 4200, and 6800. Then I use the NPV function to calculate the NPV.
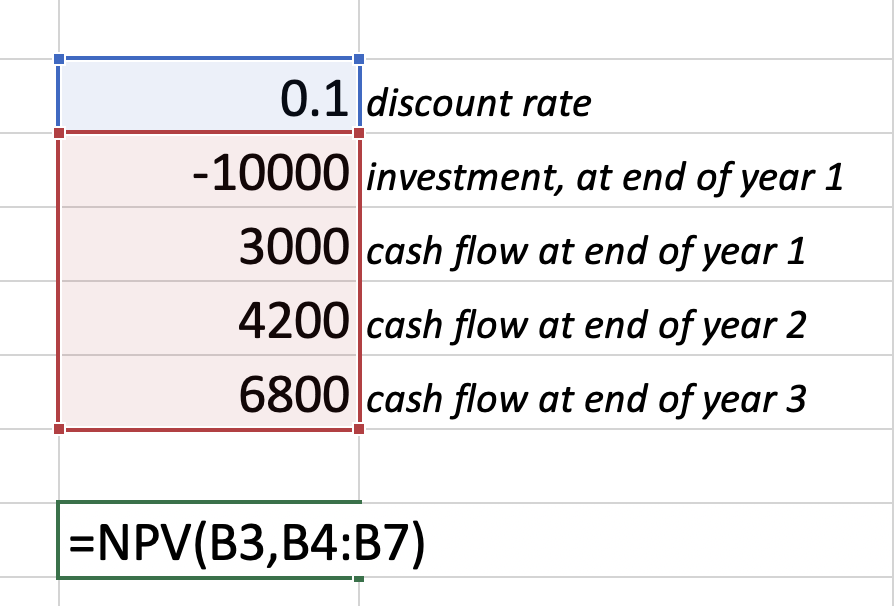
I get the same answer of $1188.44 as shown in the help article.
Now, let’s break it down and try to verify it using the first principles of cash flow discounting.

Let’s trust the explanation in the NPV function help article and do the calculations
- -10,000 is investment at end of year 1, so we discount it by 1 year
- 3,000 is cash flow from 1st year (that’s what the help article says!), so we discount it by 1 year (see formula in cell D5 =B5/(1+0.1)^1 ).
- 4200 and 6800 are cash flows from subsequent years, so we discount them by 2 and 3 years respectively.
Now we have the present values of investment as well as cash flows, let’s just add all of them to get the NPV.
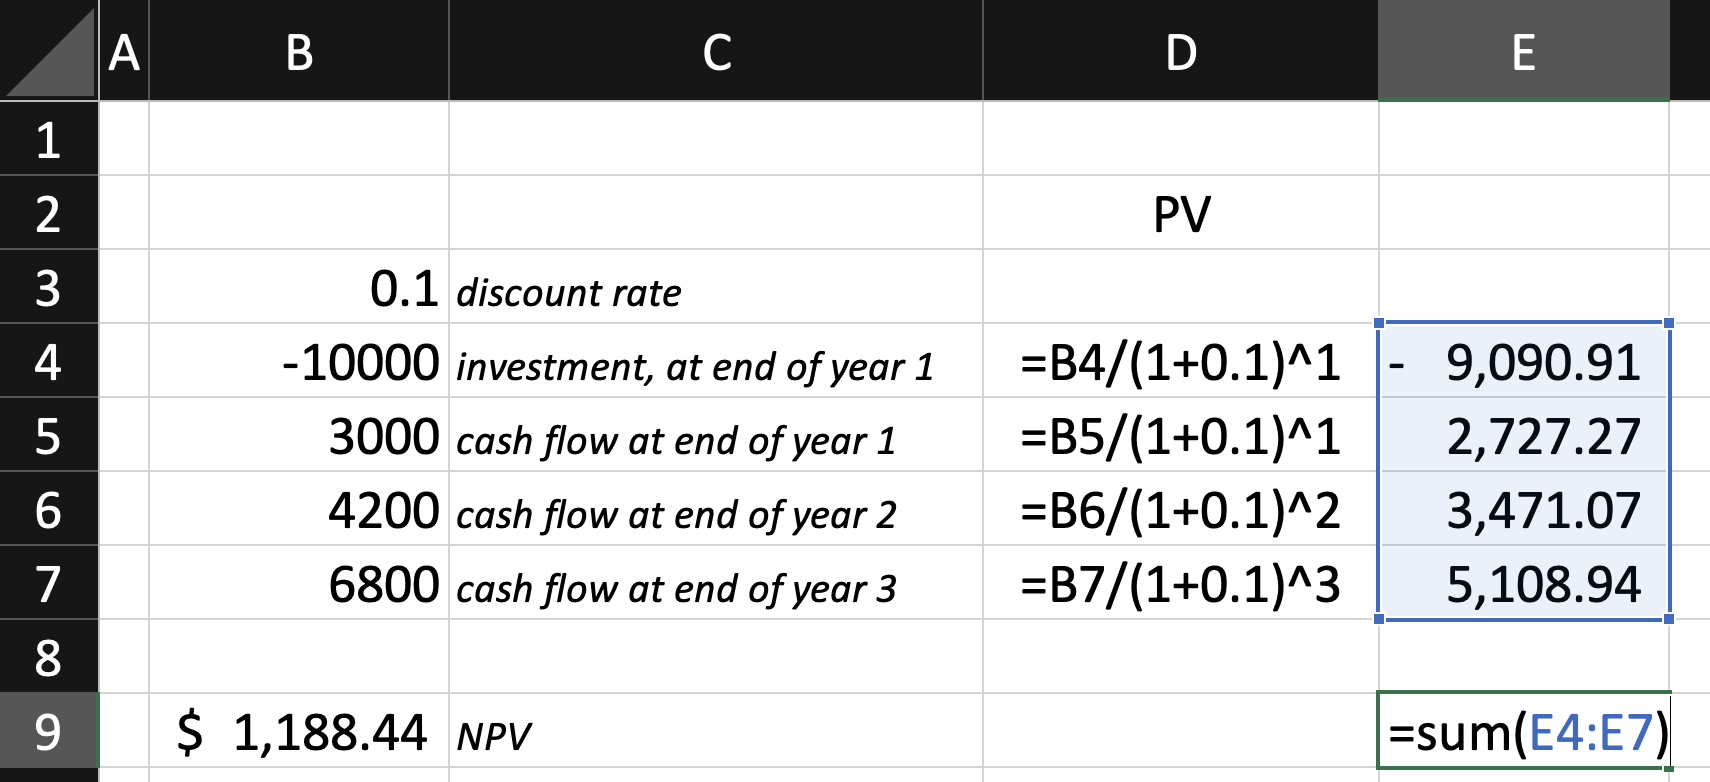
Moment of truth:
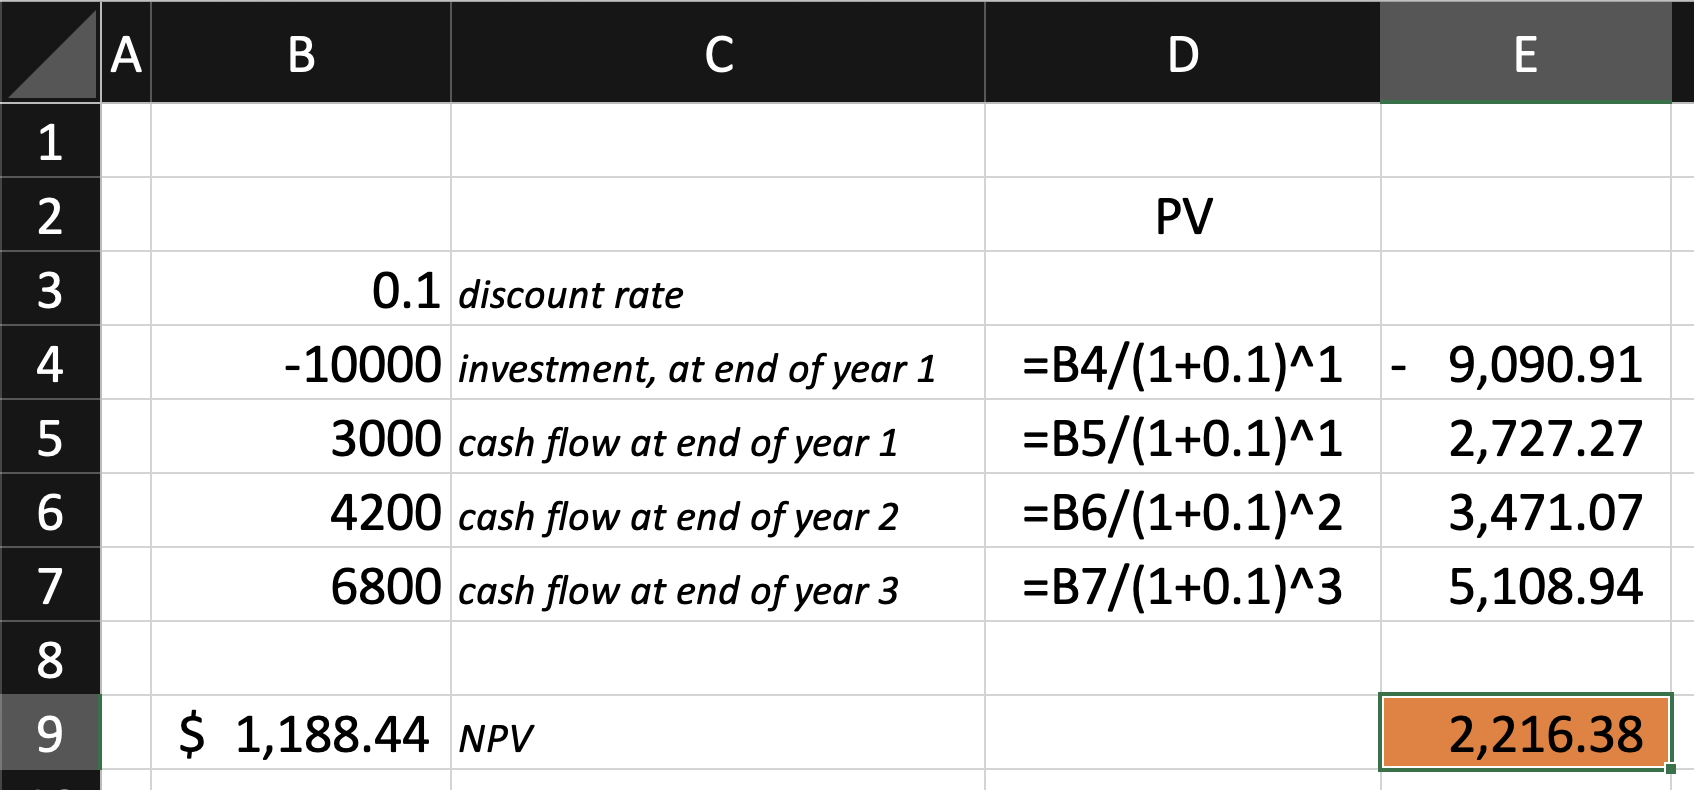
Surprise, surprise! The numbers don’t match!!!
Okay, so the help article is wrong, but what exactly is the NPV function is doing in Excel?
Actually NPV function in Excel is simply the sum of all Present Values, assuming cash flows starting from cash flows at the end of year 1.
So, let’s cross-verify this theory:
Now I have set up the sheet to compute the present values assuming the investment ‘10000’ at end of year 1, cash flow ‘3000’ at end of year 2, cash flow ‘4200’ at the end of year 3, and cash flow ‘6800’ at the end of year 4.
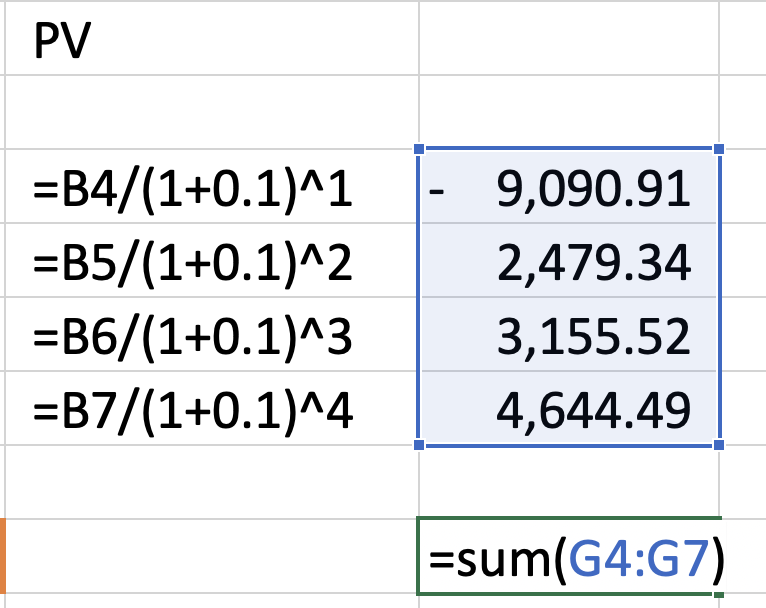
Now, let’s see if the sum of all present values matches the number output by the NPV() function.
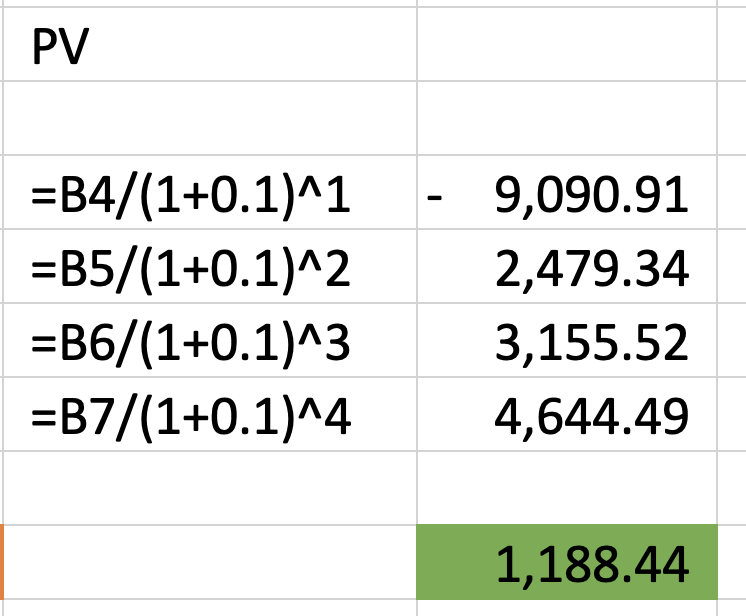
Voila! It matches!
This test was done on 20 Dec 2023 (hope a future update fixes this)
So, How To Calculate NPV in Excel?
We have already discussed two methods to calculate NPV in Excel in this article.
Alternatively, you can use the online NPV Calculator or the NPV Calculator app.

NPV Calculator | IRR Calculator
CAGR Calculator | Reverse CAGR Calculator
Learn Personal Finance
Check out our new venture multipl !


